Progress Report Campaigns
- Daniel Rehner
- Joy McLaughlin (Unlicensed)
- Jade Lynn (Unlicensed)
Getting Started
GradesFirst Progress Report Campaigns allow you to gather feedback from faculty to help determine which students may need intervention. To get started, click on the Campaigns tab.
Creating a new progress report campaign
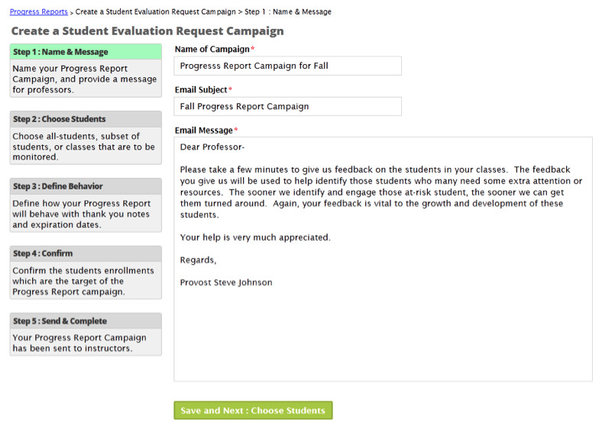
Step 1: Name & Message
Name your campaign, define the subject of your email, and write your message.
Name of Campaign: This is the name of your campaign and will be visible on the Campaign tab.
Email Subject: This is where you will define the subject of the email your professors will see.
Email Message: This is where you will define the body of the email that will be sent to your professors. A brief message summarizing what you are asking your professors to do is usually best. It is always a good idea to give your professors a “heads up” notification/email so they know exactly what a progress report is and what your expectations are.
Step 2: Choose Students or Courses
Choosing which students/course sections that will be included in your progress report campaign is perhaps the most import step of the creation process. You can select specific groups of students or entire cohorts.
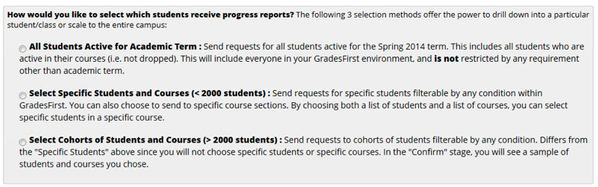
All Students Active for Academic Term. This should be used when sending a progress report campaign for all students. This option is best used if you wish to send a campaign for all students that are enrolled in the current term.
Select Specific Students and Courses (<2000 students). This option should be used when sending a progress report campaign for a selective group (or cohort) of less than 2000 students. For example, all students on the football team. When you click this option, the bottom half of the page opens up giving you a filter for both students and classes.
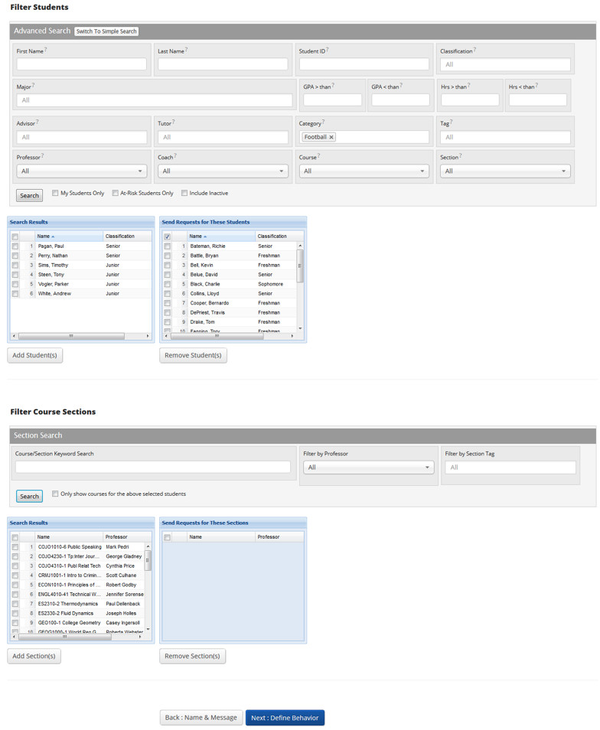
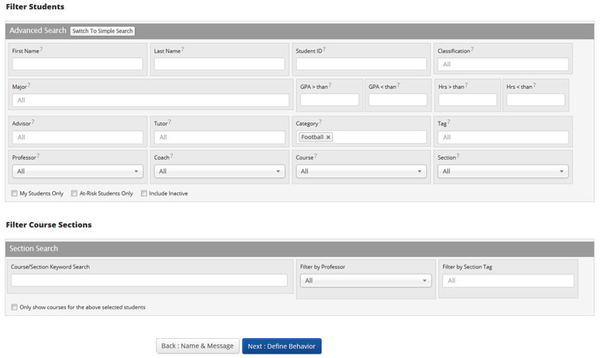
Filter Students
In the Filter Students section, you can select students by criteria. In the example above, I chose a Category of ‘Football’ and click Search. I was then presented with a list of all my Football players in the Search Results list box. I then placed a checkmark beside each student I wanted to include in my campaign and clicked the Add Students button. This moved those students to the Send Requests for these Students list box. If I wanted to add more students, for example maybe the Baseball team, I would remove the Football category, add Baseball and re-click the Search button. I would then select which Baseball players I want to include in my campaign and click the Add Students button. I repeat this search process as many times needed to select all of the students needed for my campaign. Once done, click the Next: Define Behavior button to move to the next step.
Filter Course Sections
You can use the Course Sections filter either independently of, or in conjunction with, the Student filter. If used in conjunction with the already selected Football and Baseball students, I could create a campaign for only specific courses that are taken by the students already selected. For example, I could choose to run my campaign for only Math courses for my Football and Baseball students. I would just need to search for and select all the Math courses and then click the Next: Define Behavior button.
When using the Course Section filter in conjunction with the Student filter, we have a checkbox option called Only show courses for the above selected students. When checked, this option will only display courses that are currently being taken by your selected students. Users could then select only Math courses for the Football and Baseball students in the campaign. Narrowing down the course list this way is a lot easier than searching your entire course catalog for all Math courses.
The course filter can be used independently of the student filter to create a campaign for ANY student in certain courses. To do this, do not select ANY students via the student filter and only search for and select the appropriate courses via the Course Section filter.
Once all of your students and courses have been selected, click the Next: Define Behavior button to move to the next step.
Select Cohorts of Students and Courses (>2000 students). This is the third, and last, method of selecting which students should be included in your PR campaign. This option should be used when sending a campaign for a selective group (or cohort) greater than 2000 students. For example, all freshman and sophomores. Checking this option opens up the filters shown below.
Step 3: Define Behavior
These next options are more administrative in nature. They enable the user to define parameters around this campaign to help prevent professors from being sent multiple campaign emails to when the campaign should expire and lastly, should the professors receive a “Thank you” email when they complete their evaluations.
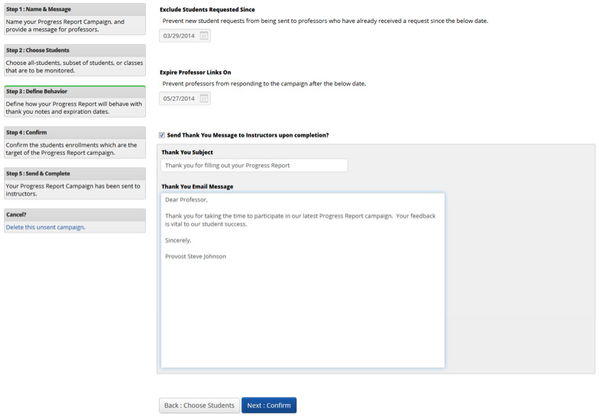
Exclude Students Requested Since: This date is used to ensure duplicate progress report requests are not sent to the same professors for the same students in the event a second campaign is sent. Let me explain further. If a progress report is created and sent on 11/1, and you upload your latest schedule changes on 11/5, therefore adding (and removing) students to classes. With an updated roster in GradesFirst, you may want to send out another PR campaign to ensure those newly added students are also evaluated. The catch is that you do not want the professors to have to re-evaluate all students again. So to prevent this, we have added the ability to exclude those students already evaluated from appearing in this second campaign. All that needs to be done, in this example, is when you create your second campaign, enter the date of 11/1, which tells GradesFirst to exclude the students who have already been evaluated from the professors list.
Expire Professor Links On: This is essentially your progress report campaign expiration date. Simply select the date you wish for any unfiled professor evaluations to expire on. If a professor tries to access the campaign after that date, they will be notified that the “link has expired.”
Send Thank You Message to Instructors upon Completion? Check this box if you wish for GradesFirst to automatically send a “Thank you” email to each professor that completes their evaluations. When checking this box, you will be able to define both the subject and message of the email. And as each professor completes their evaluations, they will automatically receive your thank you email.
Click Next: Confirm to move to the next step.
Step 4: Confirm
This final page will give you a detailed count of how many students, professors and course sections will be included in your campaign. Also, a complete list of your included students will also be displayed
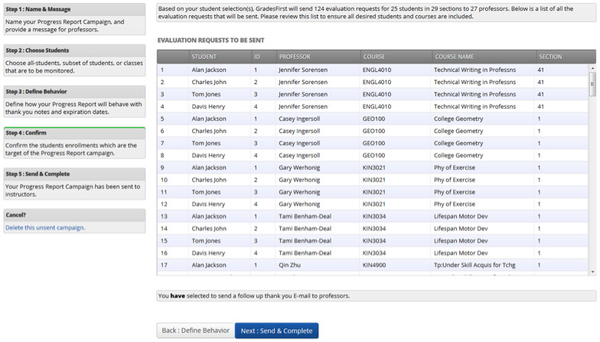
Summary at the top. This above summary will detail exactly how many students, course sections and professor that are included in your campaign. In our example, we have 25 students, 29 sections and 27 professors who will be included. We added this feature so the user creating the campaign would have some idea if the numbers seemed correct before sending.
Evaluation Requests to be Sent. We also added the ability to preview the list of students who are to be included in your campaign.
What happens if I don’t see any students in my list? Depending on how large your campaign is, this grid may populate instantaneously or it may take several hours. But in either case, you will not be able to click ‘Next: Send & Complete’ until your students populate in this grid. If this process takes a while, you do not have to wait on this page while your campaign is being built. You can go off and do other things in GradesFirst and when your list of students is done populating, GradesFirst will let you know with a “Growl” message like the one you see below.
If everything looks good, click the Next: Send & Complete button to complete and send your progress report campaign.
Quick Stats/Hide Stats
This option, when clicked, displays the same data and statistics for the campaign.
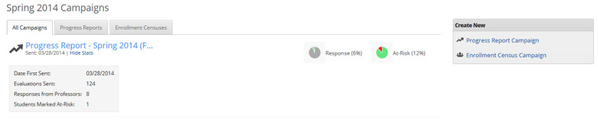
- Date First Sent: The date your campaign was sent to your professors, NOT the creation date of the campaign.
- Evaluations Sent: The total number of individual evaluations in your campaign. For instance, if your campaign consists of 5 courses, 25 students in each course, the total evaluations sent would be 125.
- Responses from Professors: The total number of evaluations your professors have submitted responses for. For instance, if 2 professors have submitted 5 students each, the total responses would be 10.
- Students Marked At-Risk: This number represents how many students, of the Responses from Professors, have been marked at-risk. For instance, in the example above, 4 of the 10 students evaluated were marked at-risk.
- Total Responses: The pie charts represent some interesting numbers. Here is a breakdown.
- Responses: This value indicates what percent of total evaluations have been submitted so far. In the example above, a total of 8 responses have been received, out of 124. This accounts for an 6% response rate.
- At-Risk: This percent is calculated by how many students have been marked at-risk divided by total responses by professors. So in the example above, it would be 1/8, which translates into 12%.
Progress Report Campaign Details
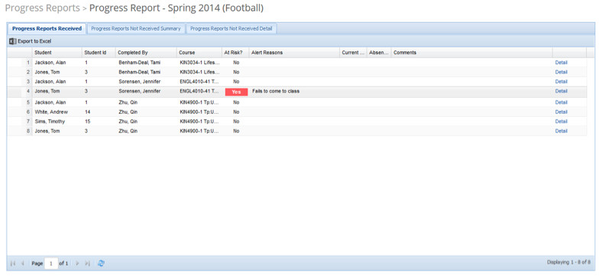
Progress Reports Received
This tab displays all the feedback that has been submitted by your professors.
Progress Reports Not Received Summary
The second tab displays all professors who have not responded or finished with your progress report campaign. Here, you can manage and track the list of professors who have not yet completed their evaluations. This tab shows information by professor.
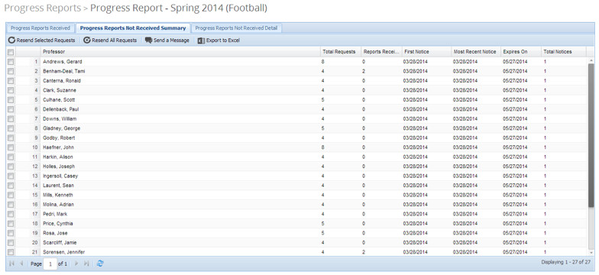
Resend Requests: This option enables you to resend the campaign request email to select professors.
This works well for sending out second (and even third) reminders. It can also be used for those professors who have lost their original campaign email.
Resend All Requests: Similar to the Resend Requests option this will resend the campaign request emails to professors, but it will do it for all professors (as the name implies).
Send a Message: Use this option to send an email to selected professors.
Export to Excel: Want to view all this information in a nice an easy to read format? Use the ‘Export to Excel’ option.
Along with the buttons, there are a few columns that probably need to be explained.
Total Requests: This column represents how many total students a professor has been asked to evaluate.
Reports Received: Will display how many students a professor has already evaluated.
Total Notices: Represents how many times you have ‘Resent Requests’ to each professor.
In summary, this is the tab you will use to view, and monitor, which professors still owe you evaluations. You can use this tab to “work” the list of professors by simply sending them an email reminder (Send a Message) to please complete your evaluations or a more formal request (Resend Request) whose email contains an actual link to each professors campaign entry page. Other information displayed on this tab will let you gauge how responsive (or not) your professors have been in completing their evaluations. Lastly, if a professor does not appear on this list, that means they have already completed their progress report campaign.
Progress Reports Not Received Detail
In many ways, this tab works almost exactly like its predecessor (Progress Reports Not Received Summary) with the except that this tab is more of a student centric view. So if you need to see a list of which students have not been evaluated, this is your tab.
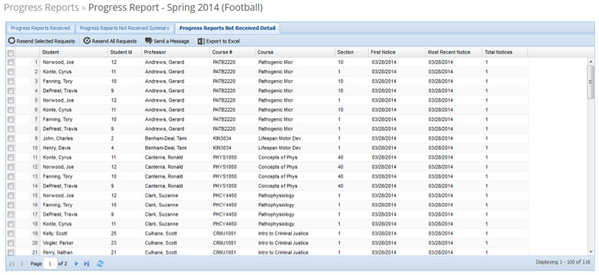
The options on this page are identical to those on the previous tab in name and function. An area of possible confusion can be “Who receives the email when I check a student’s name and click either Resend Requests or Send Message?” In both cases, the professor will receive said email.
Progress Reports Campaign Reports
Need to find out how your professors evaluated your students during a Progress Report campaign, these are your reports. We will break down each report. Users can print progress reports from one of two locations; the Campaign or Reports tab. Both tabs refer to the exact same reports.
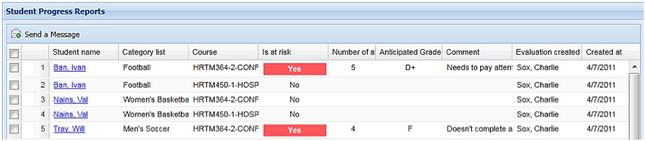
Student Progress Reports
This report, as displayed below will provide you with an overview of your progress reports within the date range you specify. This report will show any and all students who have been evaluated by their professors, depending on your search criteria.
Detailed Student Progress Reports
This report functions the exact same way as the above report, however more detailed information will be displayed with each student.
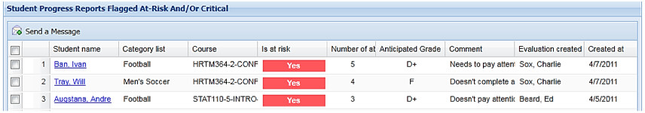
Students Flagged At-Risk
This progress report automatically limits the output to ONLY those students who were evaluated as At-Risk during the progress report process. Students who were not evaluated as at-risk will NOT appear on this report. Like every other report in GradesFirst, you can use the Advanced Filter the report on only a select group of students if desired (e.g. Show me all Football players who received an At-Risk evaluation).
Detailed Students Flagged At-Risk
This report functions the exact same way as the above report, however more detailed information will be displayed with each student.
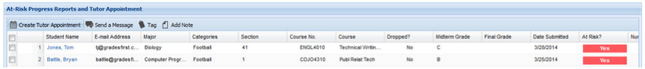
At-Risk Progress Reports and Tutor Appointment
This report shows a list of students who have been reported At-Risk in a course and any tutor appointments for that course. This report shows if students who are marked At-Risk are being processed effectively with tutor appointments. Also, with Dropped Dates, Tutor Appointment Dates, and Grades, the report shows effectiveness of those actions. Because of its size, there is not enough room to adequately display a screenshot of the report.
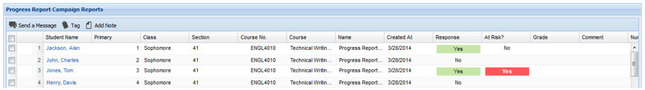
Progress Report Campaign Reports
This report will display all students who were a part of a progress report campaign via a specific date range.